Teri Campbell

Product Manager | Clinical PT turned product builder | Now building AI products that help people take the next step
LinkedIn Profile
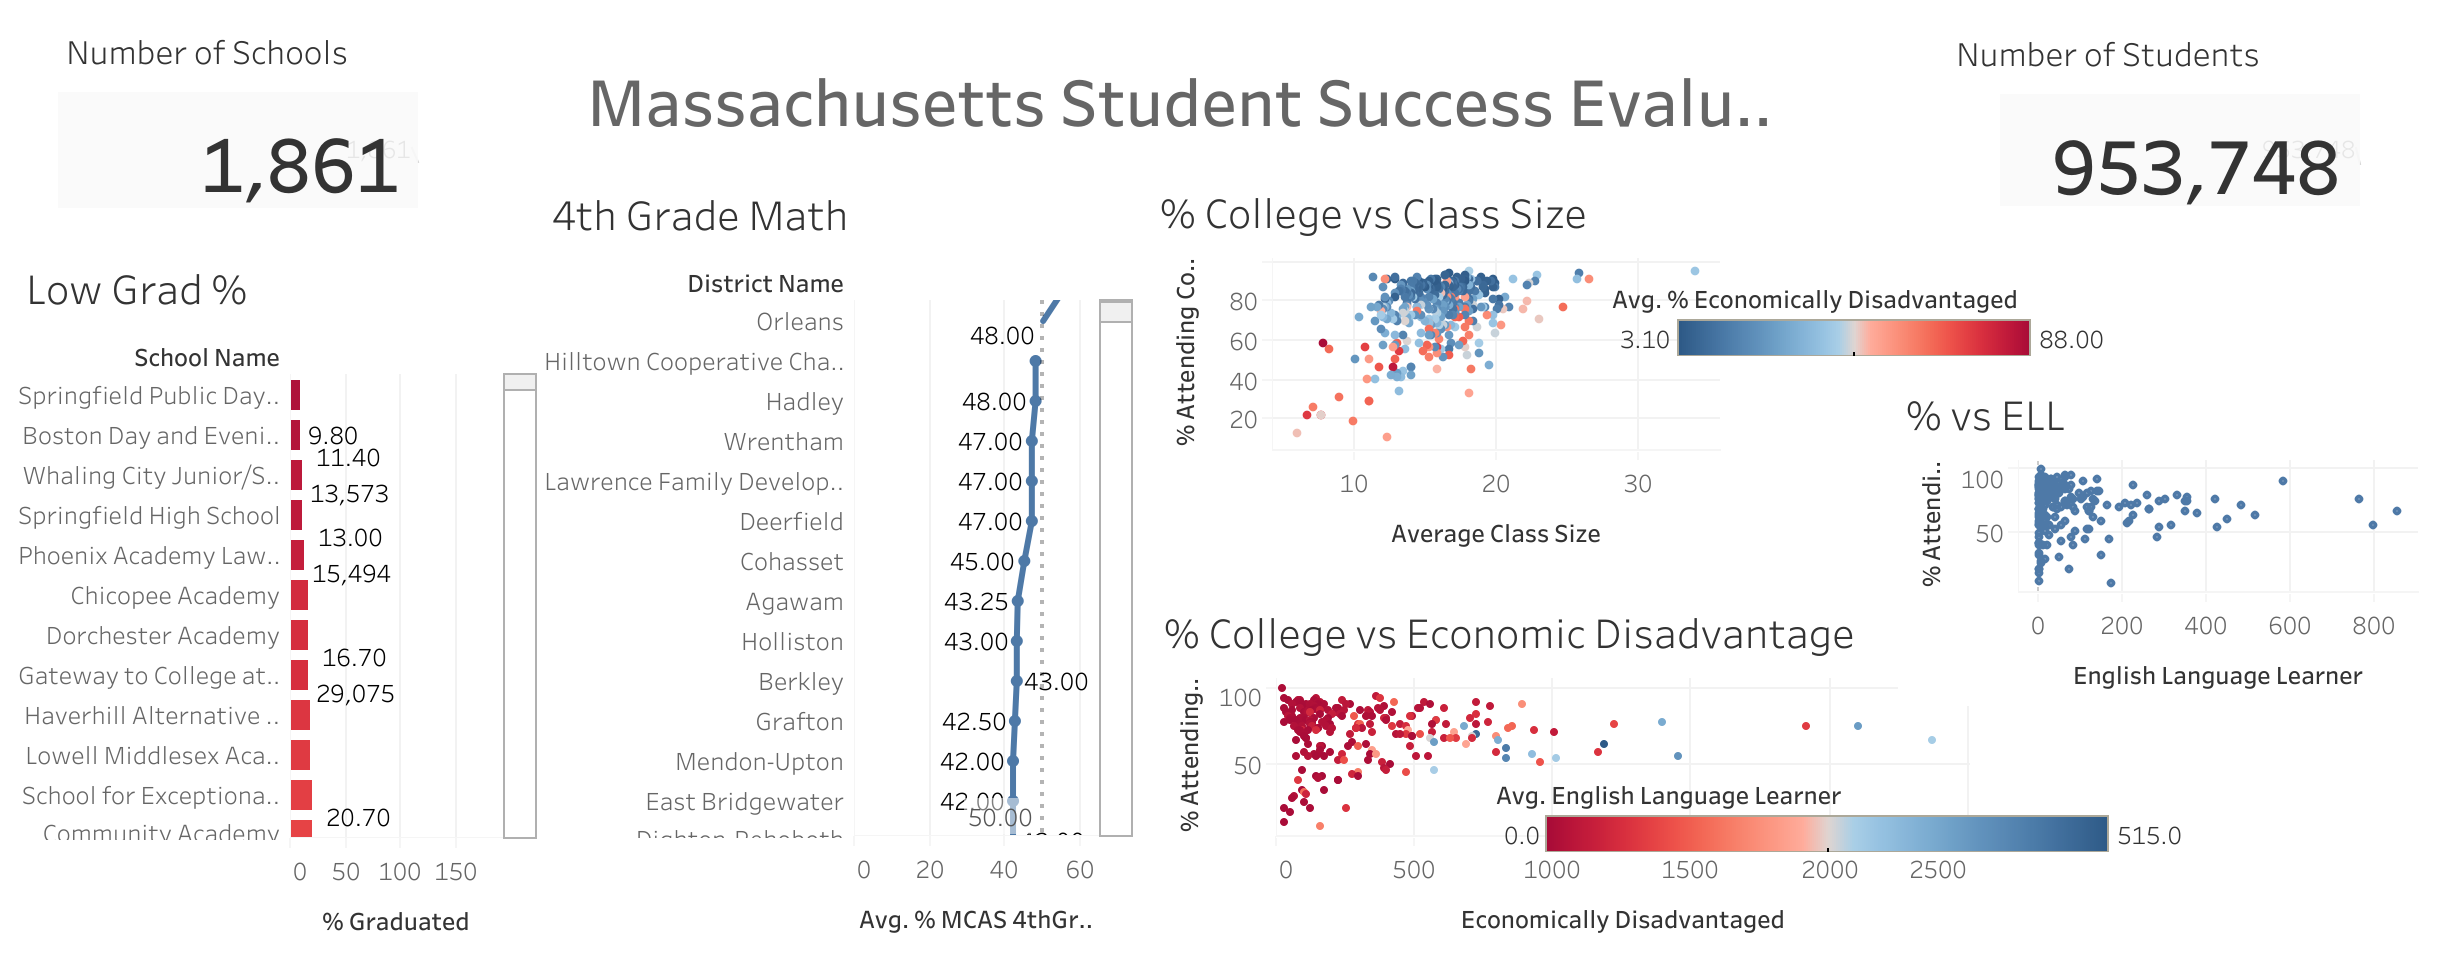
Massachusetts Student Success Analysis
INTRODUCTION
Project description: The efficacy of our education system can be a topic of debate, as can the means by which we measure how well a given state is able to educate its children.
This project focused on a dataset for the State, or rather The Commonwealth, of Massachusetts for the year 2017. The number of students who attend college after finishing high school was defined as the measure of success. Additionally, the data challenge asks the analyst to perform the analysis on the assumption that 4th grade math scores are a good indicator of academic success.
The overarching question proposed is whether or not the State should build more schools.
What I Learned
-
Class size is not a good isolated determinant of student success
-
Economically disadvantaged students are less likely to attend college
-
Schools with fewer english language learner students had increased college attendance representation
DATA
I started by uploading the provided MA_Public_Schools_2017 Excel file into Tableau Public. The data set contains 200 rows and 298 fields.
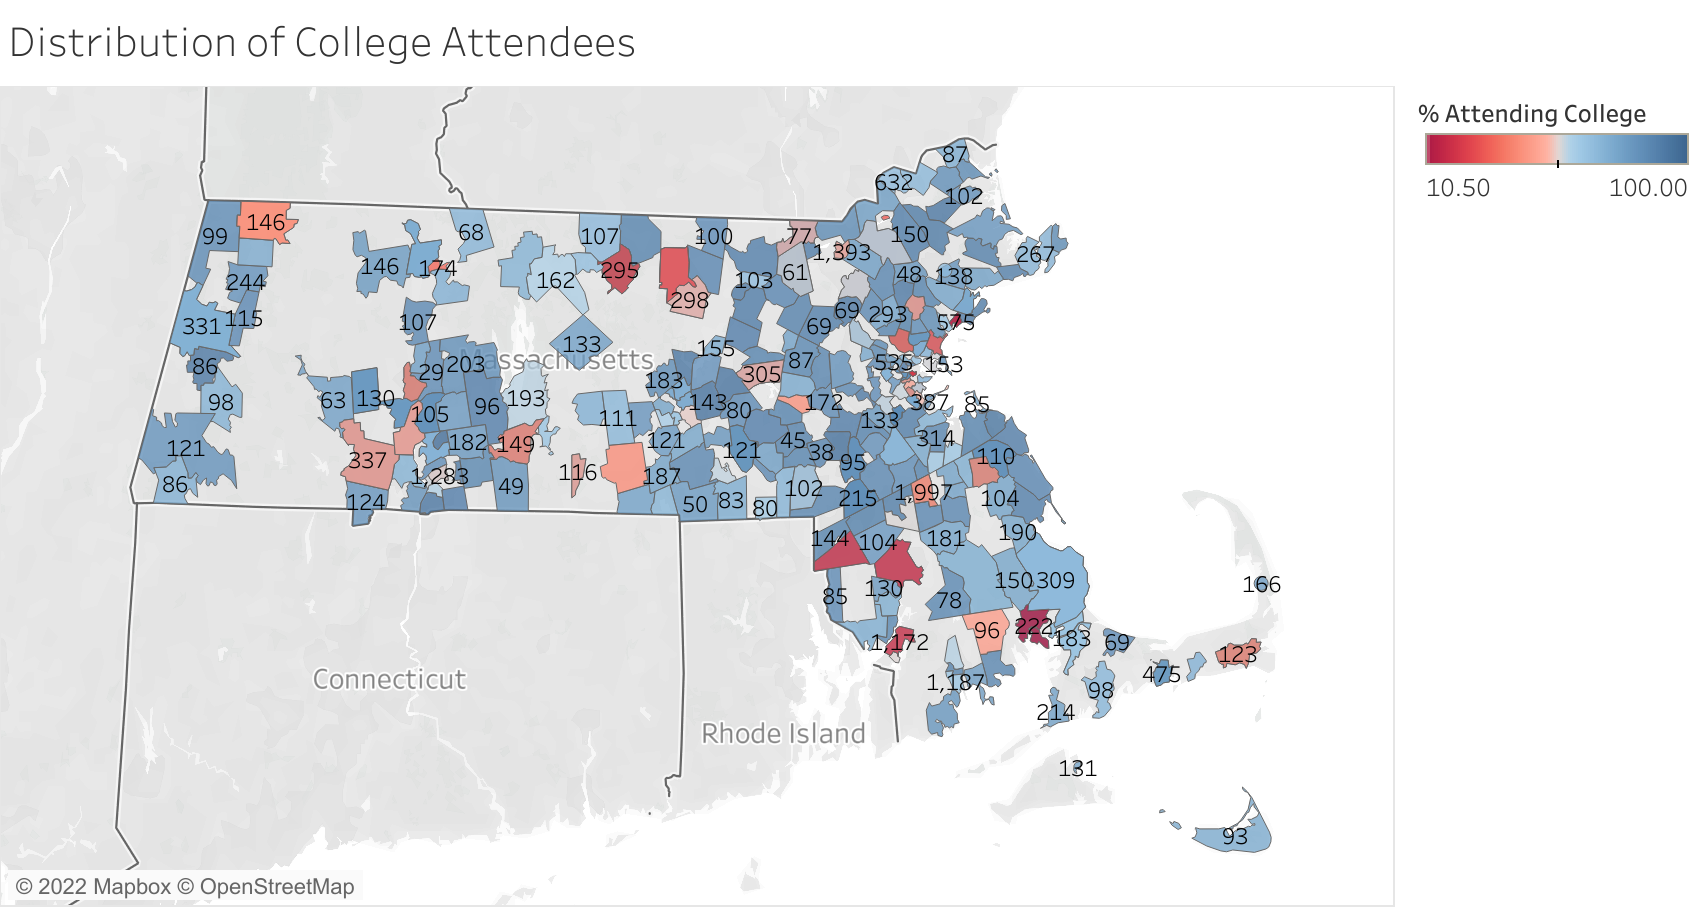
A scan of college attendees by zip code
ANALYSIS
The first task was to determine the lowest performing schools. The data was filtered to remove null values because the dataset includes primary and secondary grades.
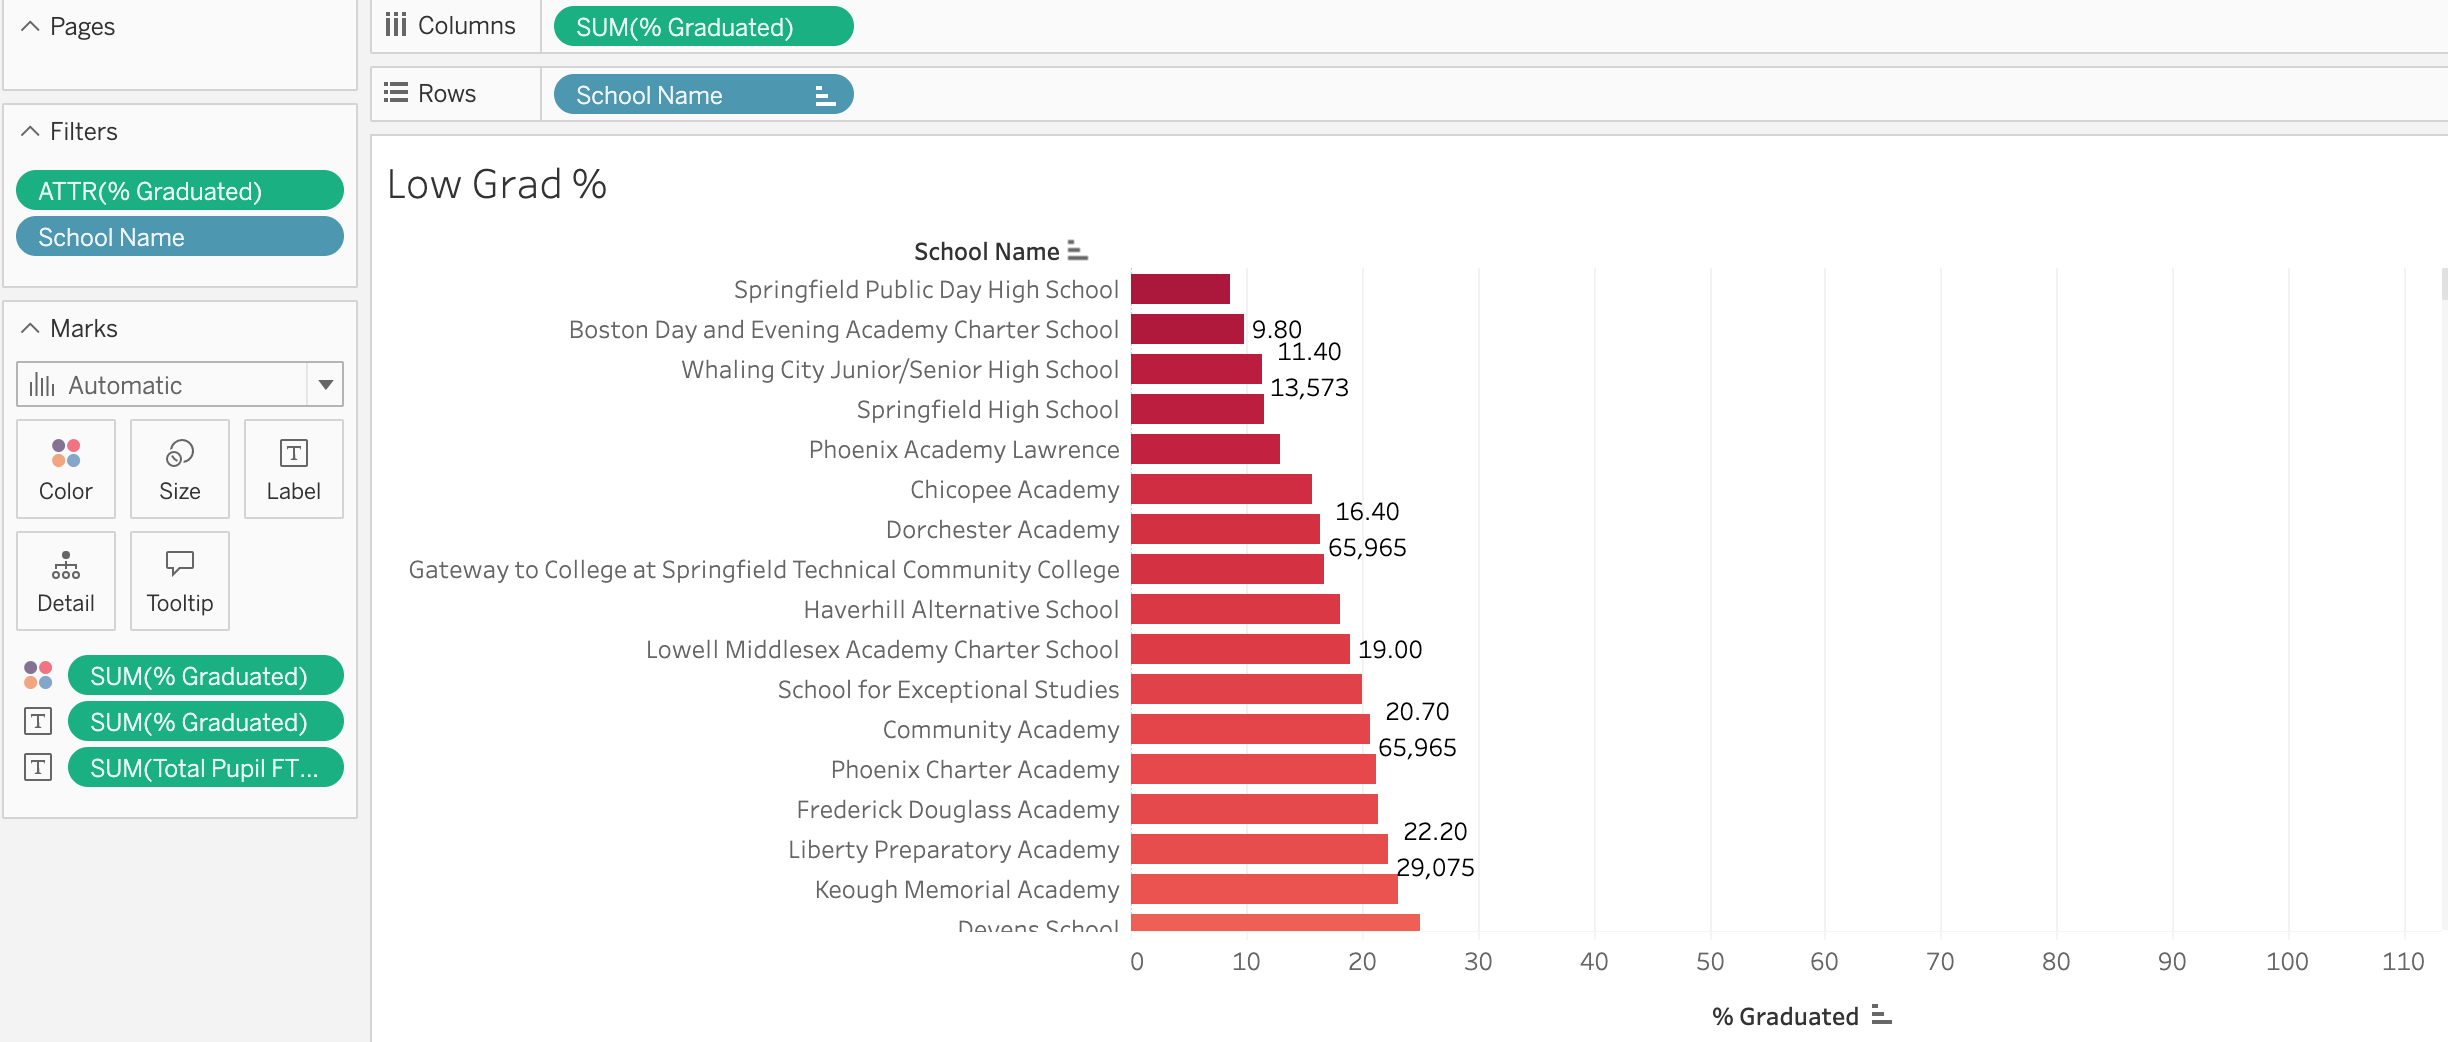
The above visualization shows school graduation rates from lowest to highest. Data for one school, Curtis-Tufts High School, which notably has a 0% graduation rate, was filtered from analysis of graduation rates. The school is an alternative high school for students from Medford High School. Graduating Students received degrees from Medford High School. I also filtered out null graduation values so that data from primary schools would not interfere with the results.
My next task was to assess the impact of class size on college attendance rates.
On initial observation, I saw a bit of an increase in college attendance as class size increased up to around 20 students per class. But, digging deeper and filtering for economic status, it is noted that economically disadvantaged youths have a decreased college attendance rate as compared to their counterparts.
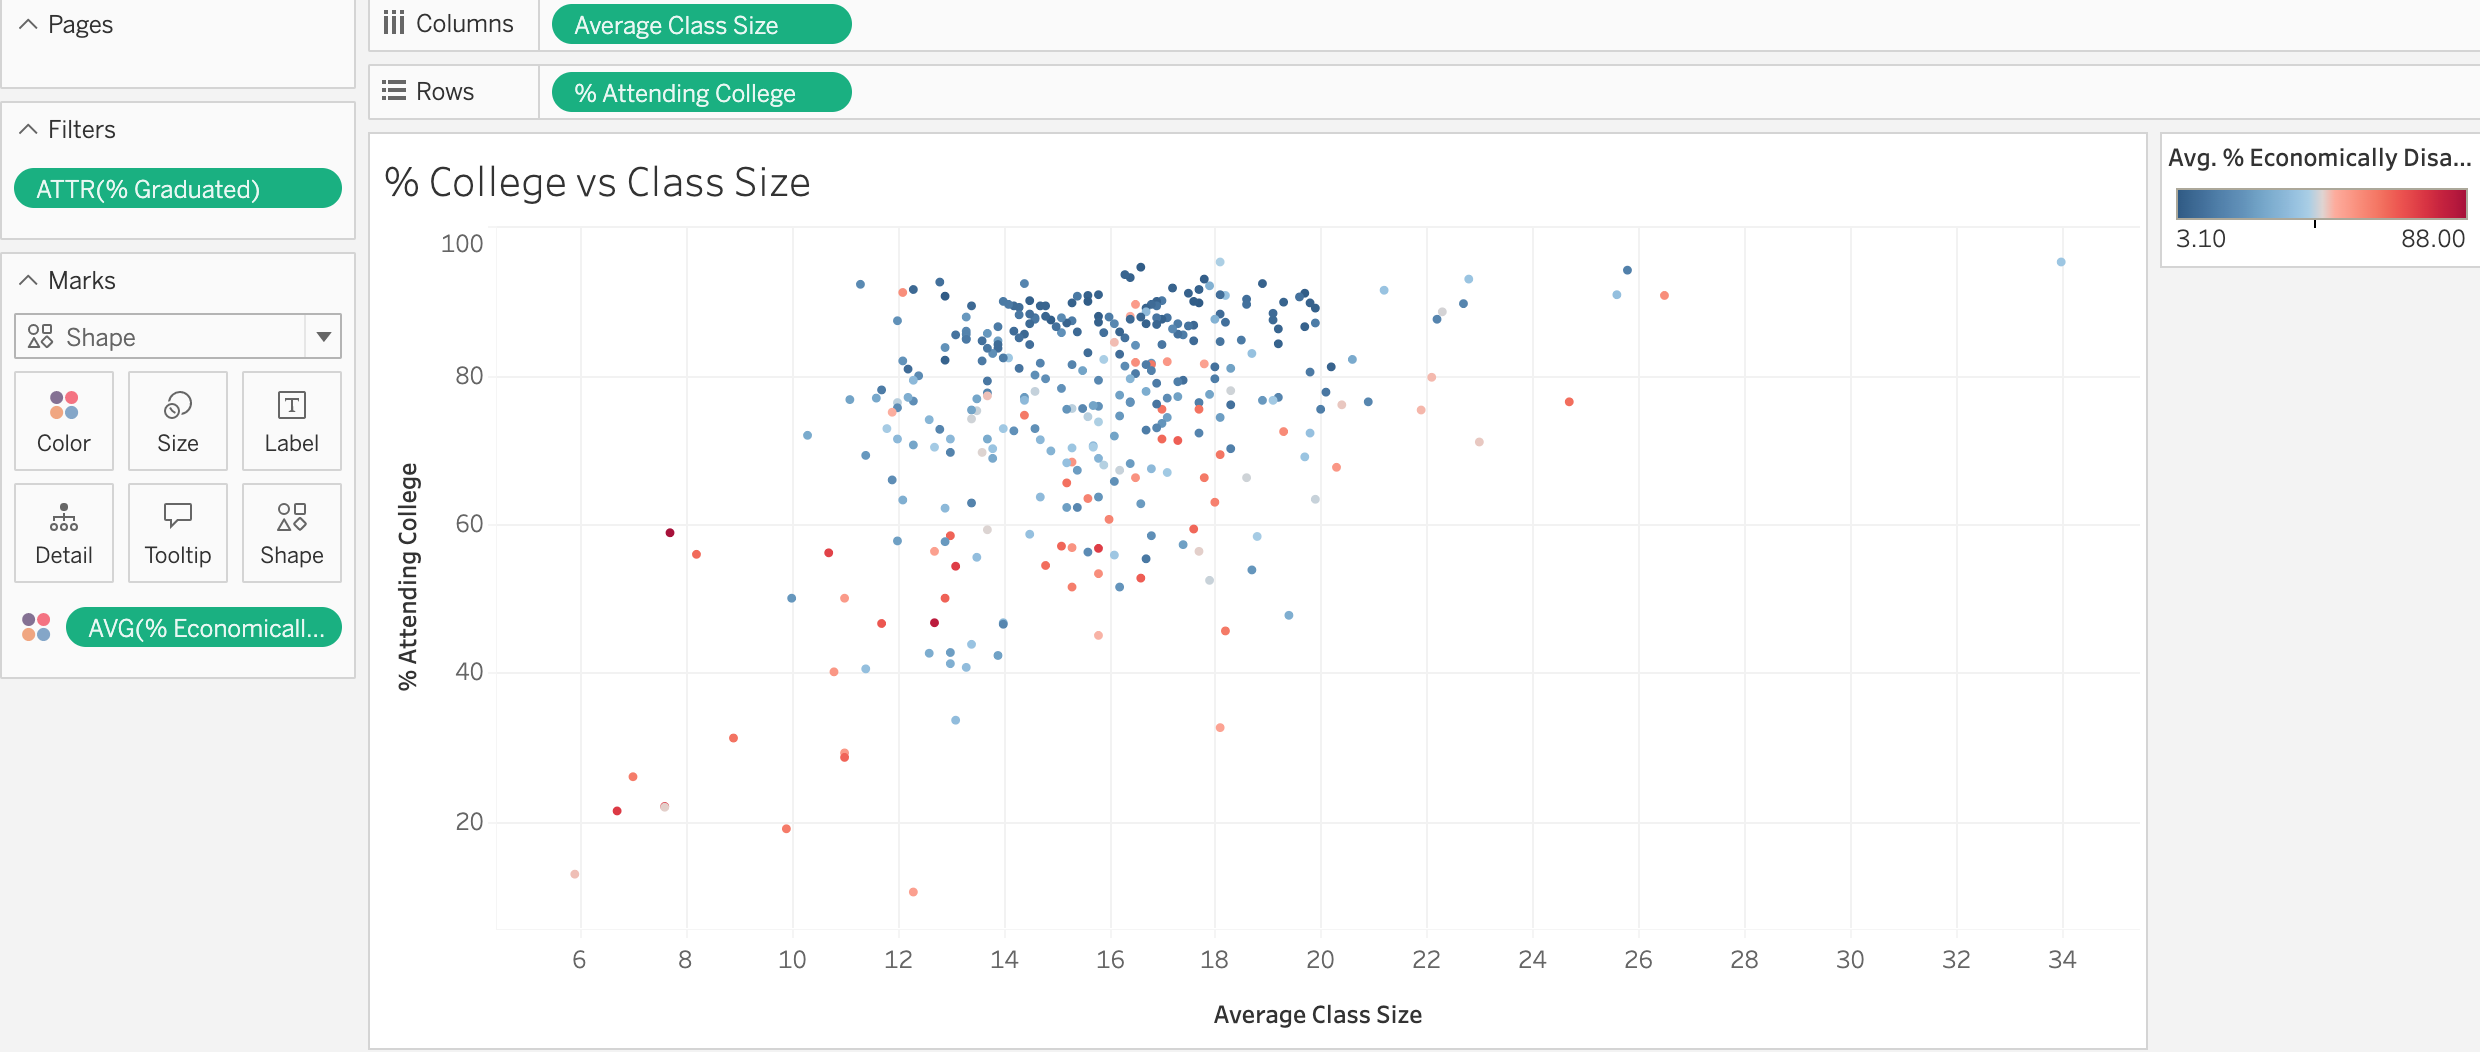 Percent of College Attendees in Relation to Class Size
Looking deeper at the impact of economic disadvantage:
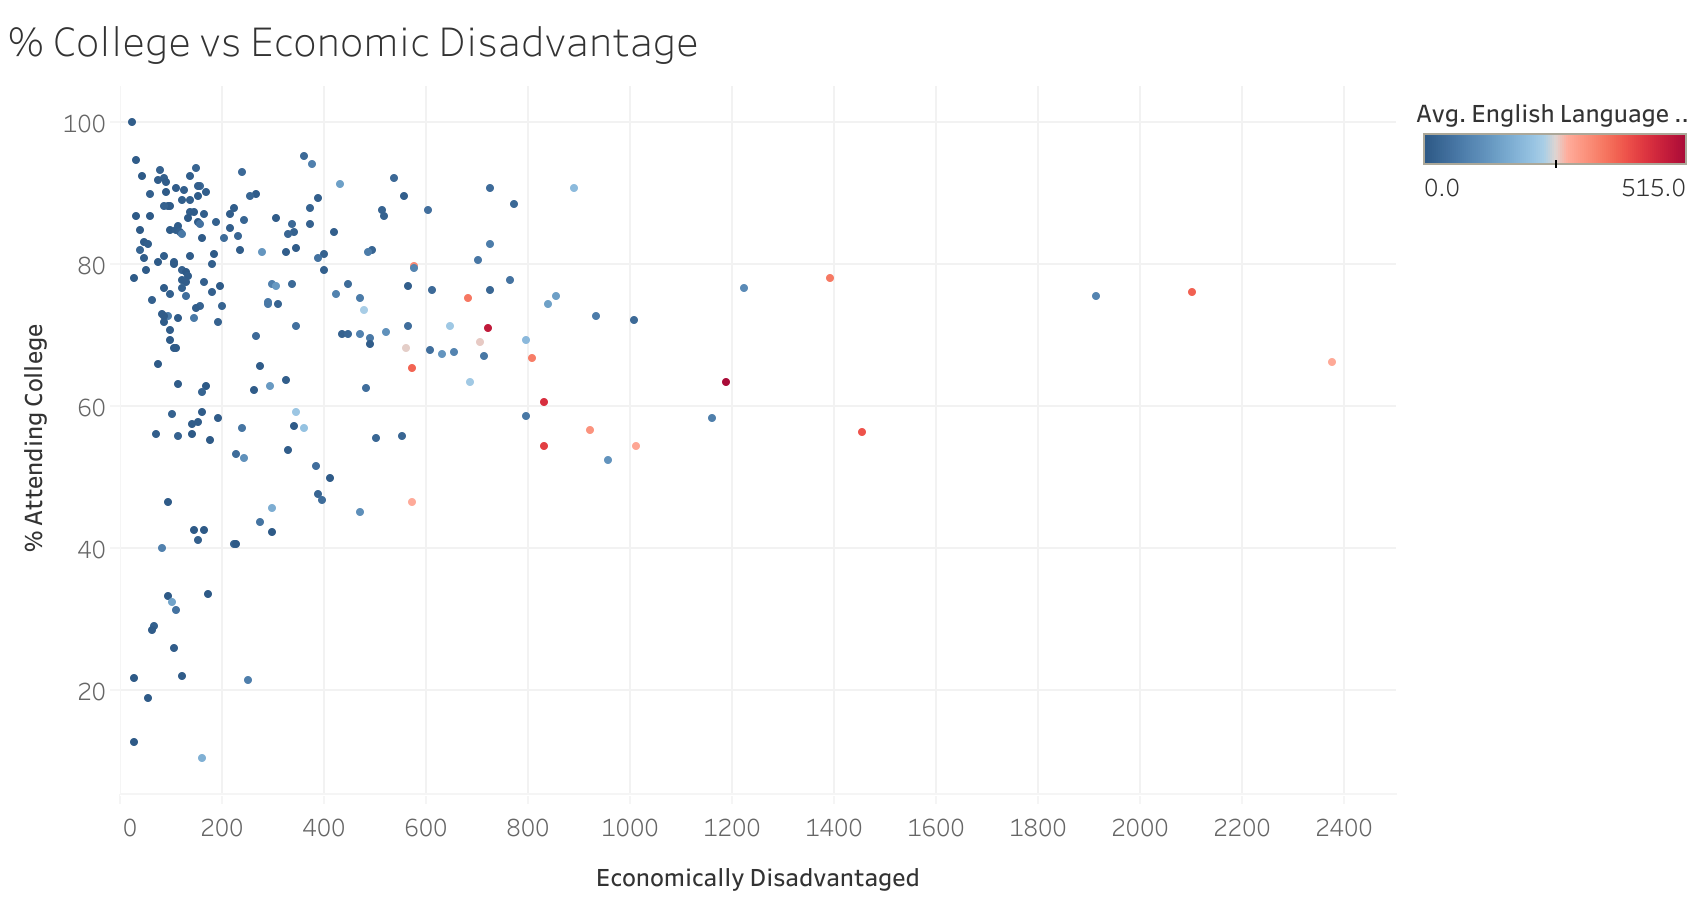 Percent of Economically Disadvantaged Students who Attend College
Clearly this shows that the schools with fewer disadvantaged students have higher rates of college attendance. Further, the students who were English language learners (ELL) in this group were less likely to attend college.
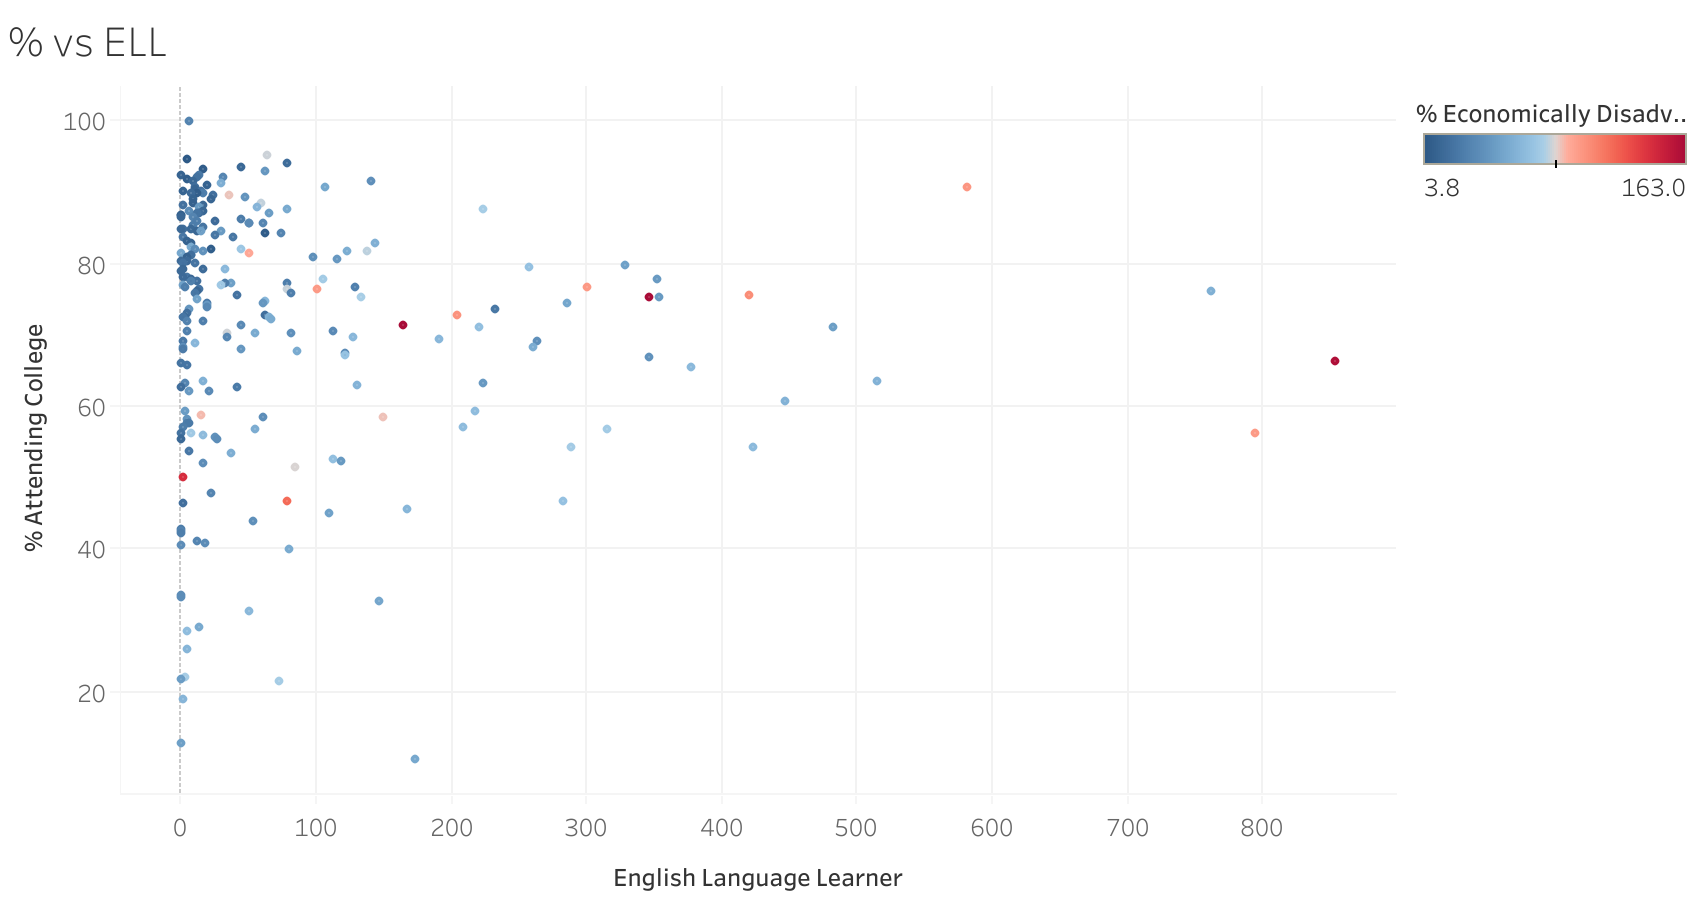 Percent of English Language Learners who Attend College
It is noted that the fewer ELL students are in a class, the greater the college attendance rate; however, economic status is distributed broadly across the percentage of college attendees when we isolate for ELL students as an isolated group.
The assumption made in this challenge is that passing 4th grade math scores are correlated with increased student success.
The next analysis looks at which schools had over 50% passing math grades in the 4th grade.
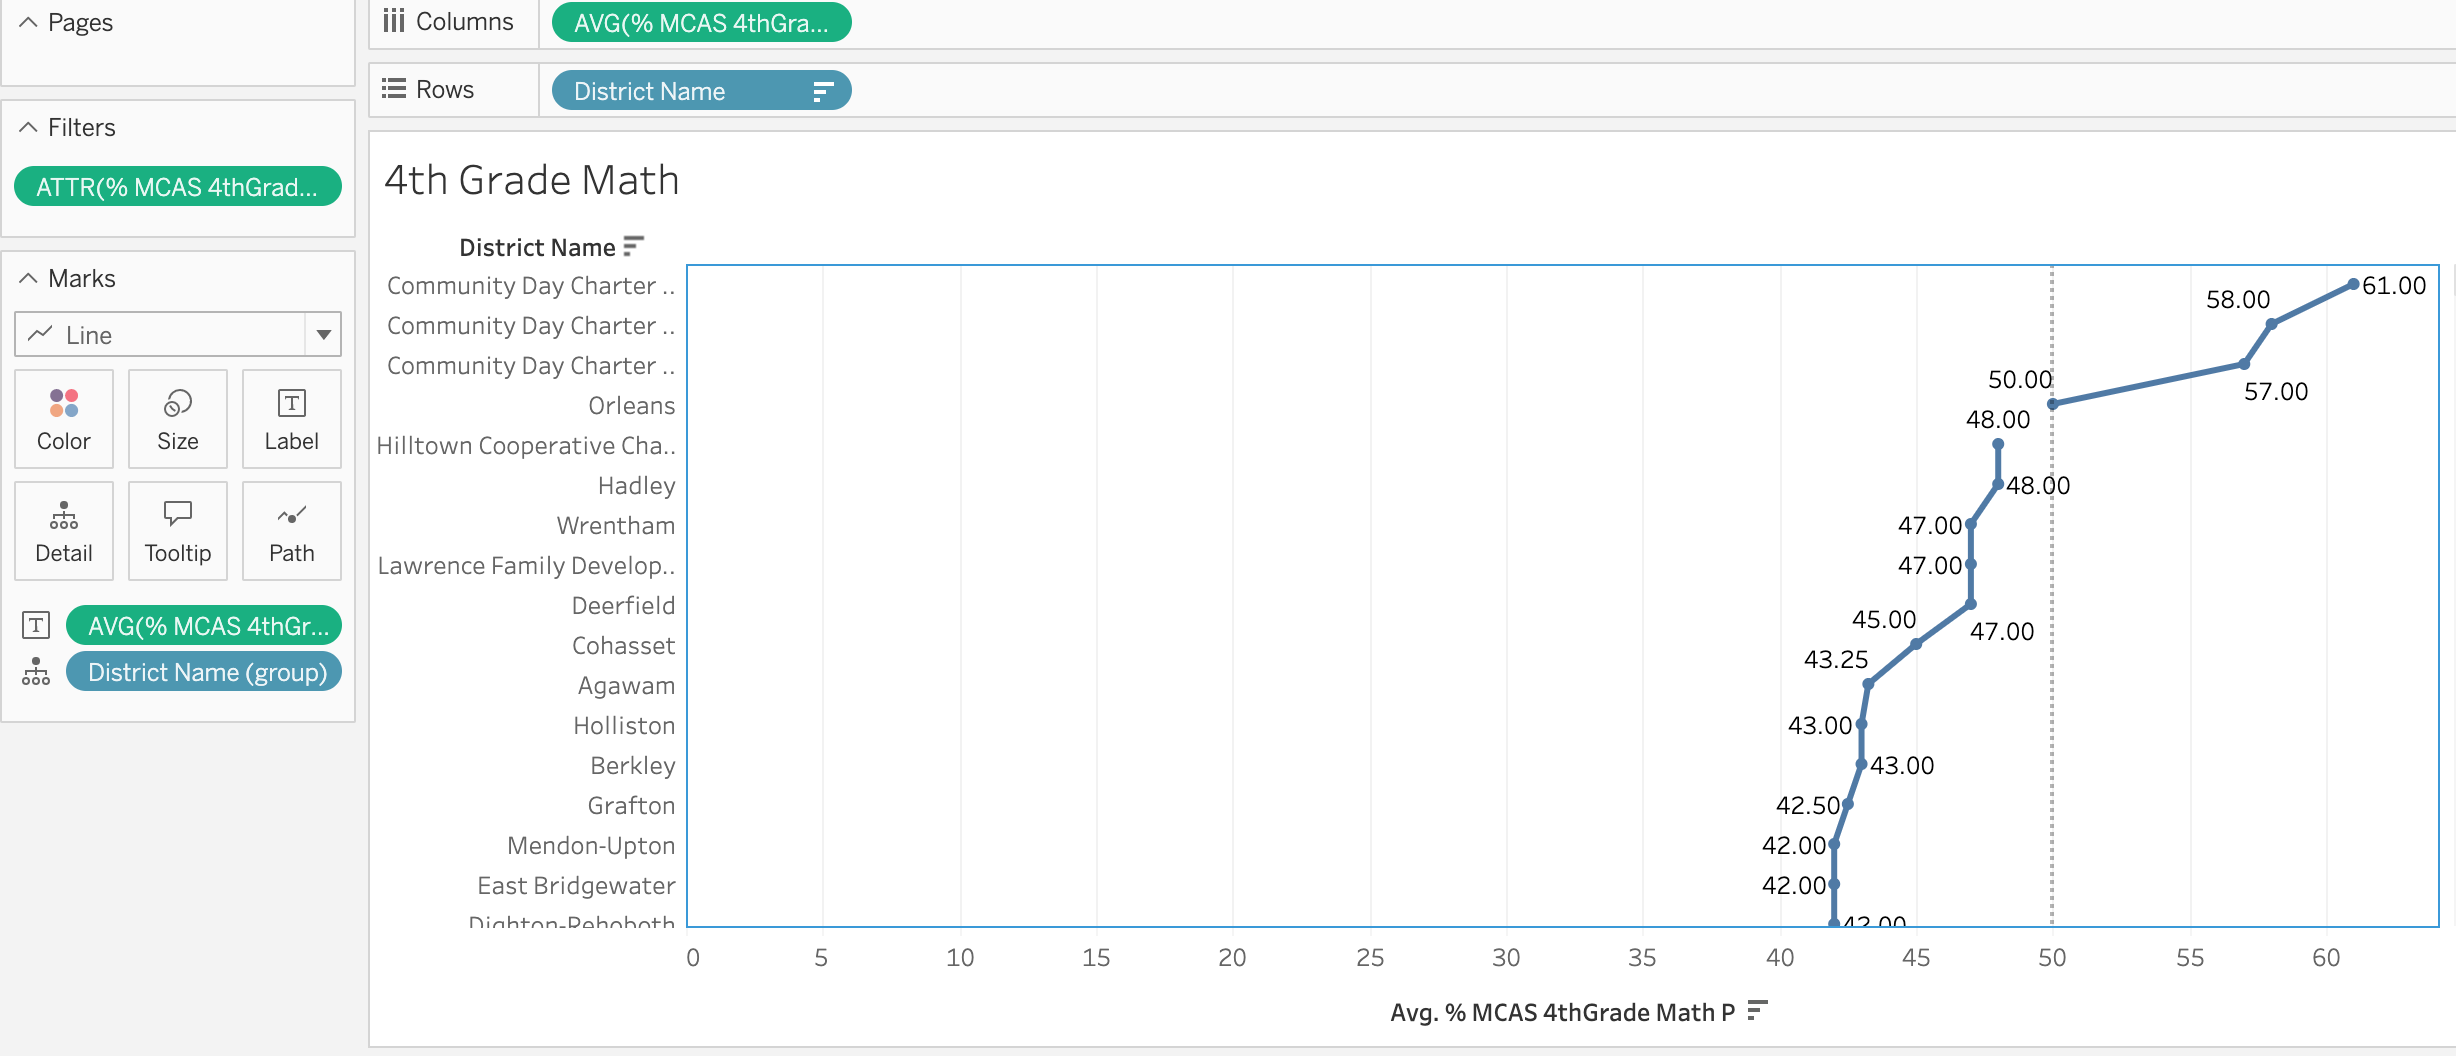
Now that these schools have been identified, educators in the high performing schools can be identified.
RESULTS AND RECOMMENDATIONS
Based on the above analysis, the following recommendations are indicated:
- It is not advised to build more schools for the purpose of decreasing class size, as it is seen that class size alone is not a good indicator of student success.
- The state should further assess intervention strategies for students who are economically disadvantaged.
- Further analysis of students who are English Language Learners is indicated to target best interventions as economic status is only one factor identified.
- Partner with educators in the identified schools that are best at teaching math to improve programs in the low performing schools.
CONCLUSION
The state has some good starting points for making positive changes to the educational system.
There is room to dig deeper into regional access to resources and other factors that may contribute to lower measures of success.
Monitoring math scores and college admissions are one way to measure “success”, but college attendance is not necessarily the only method by which an individual can live a happy, healthy, and productive life.
Further monitoring factors such as gainful employment and income, economic stability, health, etc. could be of interest in order to guide the state in regard to offering both college preparedness and trade skills opportunities at schools.